|
SAM Magnetometer stack |
|||||
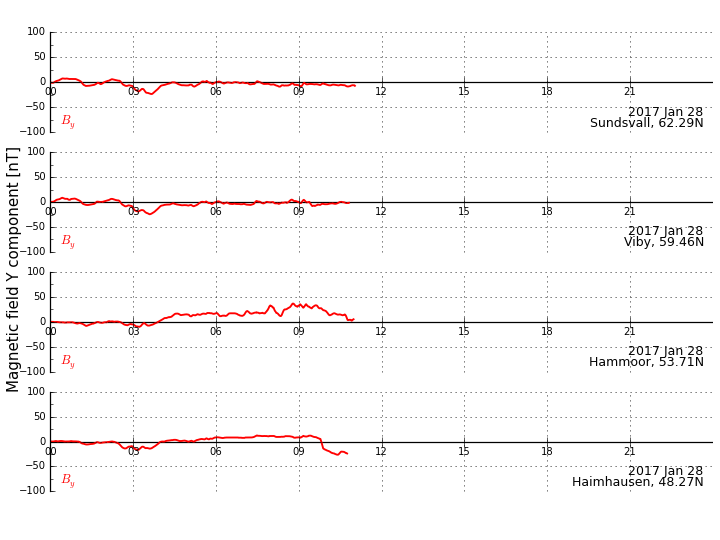
This stackplot shows the y-components of a magnetometer line spanning over about 1750 km from Southern Germany to Central Sweden. The y-component describes the change of the East-West component of the magnetic flux density:
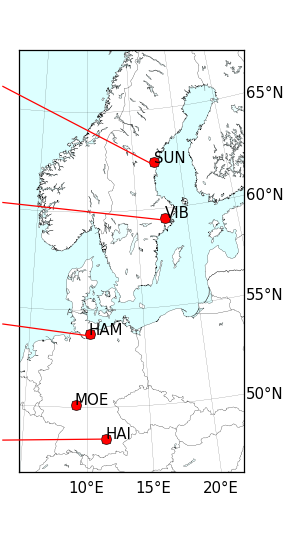
The stack plot allows to follow magnetic disturbances at different latitudes in Northern and Central Europa. The data have been obtained with magnetometers designed by the SAM Magnetometer project. So far, SAM Haimhausen (close to Munich, Germany), SAM Hammoor (run by Klaus Hartwig, data courtesy Klaus Hartwig, close to Hamburg, Germany), SAM Viby (close to Stockholm, Sweden), and SAM Sundsvall (run by Christer Byström, data courtesy Christer Byström, close to Sundsvall, Sweden) participate. The plot is upgraded multiple times per day. In the current prototype stage of this service, irregularities can be expected.
| |||||